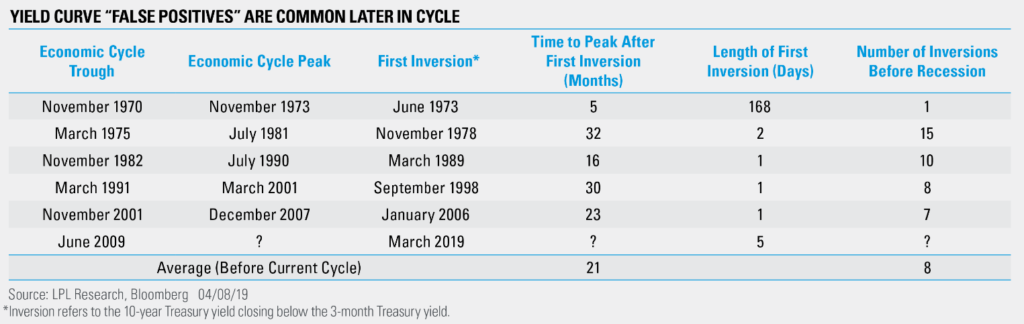
March’s yield curve commotion now looks like the first “false positive” of this expansion.
While a prolonged yield curve inversion, or long-term rates falling below short-term rates, has preceded economic recessions historically, quick and shallow inversions are common later in economic cycles. As shown in the LPL Chart of the Day, the yield curve typically flickers between positive and negative several times before the U.S. economy peaks, which has happened an average of 21 months after the first inversion.
The 10-year yield has rebounded about 15 basis points (0.15%) amid progress in trade negotiations and improving data from China, calming investors’ nerves as the yield curve climbed back into positive territory after five days of inversion. The yield curve is still historically flat, but its recovery shows that the inversion was driven more by buying pressure in long-term yields than an economic panic. There are also no significant signs of stress in other credit markets, leading us to think recent inversion was more a result of short-term technical factors.
“We’ve been encouraged by the recent recovery in long-term yields as global data have improved,” said LPL Research Chief Investment Strategist John Lynch. “Stabilizing growth and healthy domestic inflation could support long-term rates going forward.”
While yield curve inversion is worth monitoring, we would become more concerned if the negative spread were to widen significantly. Historically, the spread between the 3-month and 10-year yields has become much more predictive of a recession at -50 basis points (-0.50%). The U.S. economy has averaged about 13 months to an economic peak when the spread falls that
For more of our thoughts on the economic landscape, check out this week’s Weekly Economic Commentary.
IMPORTANT DISCLOSURES
The opinions voiced in this material are for general information only and are not intended to provide specific advice or recommendations for any individual security. To determine which investment(s) may be appropriate for you, consult your financial advisor prior to investing. The economic forecasts set forth in this material may not develop as predicted.
All indexes are unmanaged and cannot be invested into directly. Unmanaged index returns do not reflect fees, expenses, or sales charges. Index performance is not indicative of the performance of any investment. All performance referenced is historical and is no guarantee of future results.
Investing involves risks including possible loss of principal. No investment strategy or risk management technique can guarantee return or eliminate risk in all market environments.
This research material has been prepared by LPL Financial LLC.
To the extent you are receiving investment advice from a separately registered independent investment advisor, please note that LPL Financial LLC is not an affiliate of and makes no representation with respect to such entity.
The investment products sold through LPL Financial are not insured deposits and are not FDIC/NCUA insured. These products are not Bank/Credit Union obligations and are not endorsed, recommended or guaranteed by any Bank/Credit Union or any government agency. The value of the investment may fluctuate, the return on the investment is not guaranteed, and loss of principal is possible.
For Public Use | Tracking # 1-841006 (Exp. 04/20)